Blog

According to the GRO indices, since 1837 there have been ten boys registered with the forenames, Napoleon Bonaparte.

Emma Jolly, in the article NAMING NAPOLEON: how exploring first names can give an insight into Victorian world history.

Emma Jolly writer, historian, genealogist
  1. Book Review and Author Interview: Ancestoring: Understanding Records, Family, and Ourselves by Darcie Hind Posz

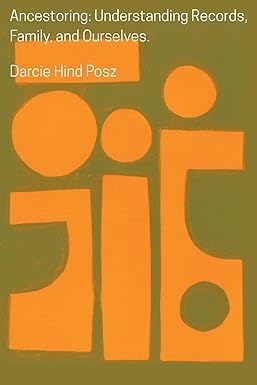
    Ancestoring: Understanding Records, Family, and Ourselves by Darcie Hind Posz (Genealogical Publishing Company, 2026)

    In 1926, Carl Jung concluded a lecture to a literary society in Augsburg with the claim that the archetypes buried in our collective unconscious carry ‘the deposit of man’s whole ancestral experience,’ which genealogist Hank Jones later interpreted in Psychic Roots as meaning that ‘we inherit the wisdom of the experience of our ancestors without ourselves having personal experience.’ This is one of many thought-provoking influences and references that appear in this exciting new book from accomplished US genealogist and writer Darcie Hind Posz. Its eighteen chapters are alive with ideas and inspiration. I found it fascinating and have found myself returning repeatedly, pondering how I can apply the thoughts and examples to my own family history. Completely different from many of the genealogy books out there, Ancestoring brings influences from the current memoir or ancestral self-discovery vein, which has prevailed in publishing in recent years. 

    In her preface, Hind Posz defines Ancestoring as, ‘The observation and collection of methodologies, theories, and solutions to everyday items as related to genealogy.’ The entire book involves fresh ideas and inspires the reader to look anew at their own family tree and the assumptions they’ve made about their ancestors. From its title to the use of examples (the section on source analysis, in particular, is revelatory) and quotations from a wide range of genealogical papers, this is something original and illuminating. 

    The book’s dedication quotes from William B Saxbe, Jr., who refers to ‘thoughtful genealogists’. That appears to be the target audience here. If you consider yourself a ‘thoughtful genealogist’, then, without doubt, this is the book for you.

    Interview with Darcie Hind Posz, CG®, FASG

    What was your background before writing this book? 

    I have been working in libraries and as a genealogist for twenty years. I have been a verifying genealogist for several lineage societies. I have worked as an editor for a publication. I have volunteered. When I was not doing that, I was finding time to write, which I enjoy. 

    I hadn’t heard the term “Ancestoring” before this. How did you come up with the title of the book? 

    At first, I wanted a field guide or something like a field guide for all of these methods that I had used over the years that worked for me. I liked ancestoring to describe it because it was not strict, but a bit whimsical and in that grey area. I had the idea in 2017 originally to use pictures to describe how I visualized solving genealogical problems I carried with me, and I had begun to collect notebooks full of doodles. During the pandemic, I came back to the notebooks because I was running out of projects. It kept getting bigger, so I made myself commit to finding a publisher open to a book that is hard to describe. 

    This is your fourth book. How does it differ from your previous titles? 

    This book is different because I feel like I got to keep my voice in it. When you write a genealogy, you are an observer of a family; your tone is kept in check with the documents formulating the narrative. When you write about a region, again, you are kept in check by the resources you are discussing. Both are pointing the reader to resources and then a family narrative to evaluate and observe. But getting to the part where you have a final family narrative to publish or distribute is not that simple. There are rabbit holes, diatribes, blind alleys, and other things (like losing an entire line in the pedigree), where they have no room in the final product. I wanted to show that and work in progress because what didn’t work for my genealogical problem may work for someone else’s. 

    In Part Two (Understanding Families), you write: “Rather than judging our subjects, which will likely flatline the part of our brain we use to understand them, observe and evaluate their actions.” This approach strongly resonates with my own work in personal family history research, as well as what I encourage in my clients. Do you think genealogists are shifting in how they approach their ancestors (e.g. those considered “black sheep”) compared to how family history was typically handled in the recent past? 

    I hope they are. It is hard. It would be nice to have deeper conversations about topics like this. It is easy to judge swiftly when an ancestor does something and to label it. But we need to think of those we study not as something like a document. As their lifetime progressed, they shifted and changed. Think about how you have done things during your life. Maybe you did something that seemed like a good idea at the time, and now you regret it. We all do it. Those we study in genealogy did the same. That is why I liked to frame it as withholding judgment, so that you do not know yet if they are the good or bad person in the story. Just watch longer. 

    In Part Three (Understanding Ourselves), you touch on genetic genealogy, writing that, “DNA will overturn many previously proven or established pedigrees.” What is the most powerful discovery you have made through DNA research? 

    I was sure of my lineage until DNA overturned it, and although DNA is this wonderful evidence available now, just like documentation, we will have to wait as more of it becomes available by waiting for more people to take DNA tests and providing a larger pool for those of certain ethnicities. I will spend the rest of my life combing through match lists to see if there is a hint of that line! Since it will be a lifelong process, I will need to keep up-to-date on the technology and methods for it. 

    What are your future plans? Can we expect more books from you?  

    More books, of course! 🙂

    Darcie Hind Posz, CG®, FASG, is an author, genealogist, and researcher, and has been a board-certified genealogist since 2013. In 2023, she was elected a Fellow of the American Society of Genealogists. Darcie Hind Posz is an author, genealogist and researcher. Posz authored three other books: Chicago Stones: A Genealogy of Acquisition, Influence & Scandal; Recast: Vital Events Published in Variety in 1918 and 1919; and Research in Hawaii, part of the National Genealogical Society’s Research in the State series, was published in 2024. Her extensive bibliography can be found at her website, darciehindposz.com


  2. Genetic Genealogy – Biogeographical Ancestry

    Biogeographical ancestry (BGA) is now the preferred and more accurate term for what DNA testing companies have traditionally called “ethnicity.” Another commonly used term is BioAncestry.

    Until recently, genetic genealogists—including myself—referred to these findings as “ethnicity results.” To align with current terminology, I am updating this blog with the preferred terms and sharing my latest results.

    The five most popular DNA testing sites for ancestry and health insights are AncestryDNA, 23andMe, MyHeritage DNA, FamilyTreeDNA, and Living DNA.

    Ancestry

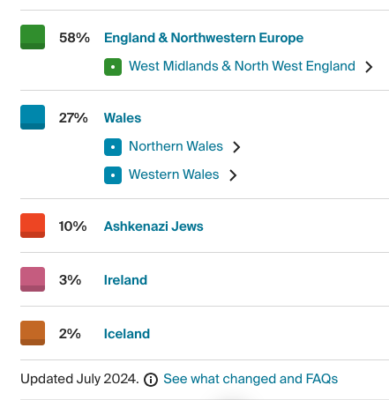
    Ancestry’s most recent BGA update was in July 2024, and my results align well with my documented family history.

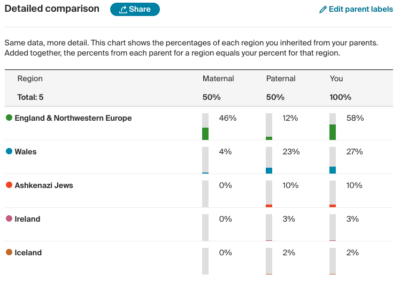
    I was especially pleased to see the West Midlands highlighted, as this is where most of my maternal ancestors lived in recent centuries. The Welsh ancestry reflects both my paternal and maternal heritage, while the 10% Ashkenazi Jewish matches what I would expect from my great-grandfather.

    The 3% Irish may be linked to either my Scottish or West Welsh ancestors, but the Icelandic component appears to be an anomaly—I suspect it will disappear in the next update.

    23andMe

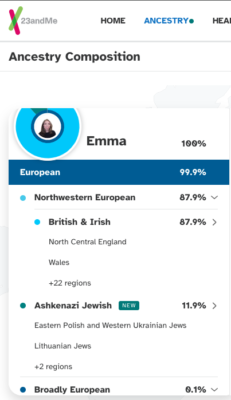
    Like Ancestry, 23andMe has accurately highlighted my West Midlands heritage. Even better, it identifies my mitochondrial haplogroup as T2b, which aligns with my known ancestry.

    23andMe categorizes my Ancestral Composition as European, further dividing it into Northwestern European and Ashkenazi Jewish, with percentages that match my documented family history.

    One advantage of 23andMe is its detailed regional breakdown beyond just the West Midlands. It identifies four distinct British regions in my ancestry:

    North Central England

    Defined as “north central England and parts of the West Midlands, including Staffordshire, Leicestershire, West Midlands, Cheshire, and Derbyshire.”

    • Common maternal haplogroups: H1, T2b, and H1c.

    • Since my maternal haplogroup is T2b, this fits well with my ancestry.

    Wales

    Defined as “Wales and England’s Welsh border counties,” which includes parts of the West Midlands.

    • Common maternal haplogroups: J1, H1, and T2b.

    • Again, T2b is listed, reinforcing my maternal connection to this region.

    West Midlands

    Defined as “Shropshire, Staffordshire, Worcestershire, Herefordshire, and Warwickshire,” though most people in this genetic group have ancestry near Birmingham.

    • Common maternal haplogroups: J1b1a, R0, and H1.

    • Interestingly, T2b is not listed here, even though my maternal line is from the West Midlands as far back as I have traced. However, since T2b appears in both the North Central England and Wales groups, it suggests my maternal ancestors may have been in this broader area for centuries. More research is needed!

    England & Southern Uplands of Scotland

    This category covers all of England and parts of upland Scotland.

    • Common maternal haplogroups: U5a1a1, H5a1, and H1b.

    On my paternal side, my Ashkenazi Jewish ancestry does not come from my Y-DNA line but from a different paternal branch. We know that my 2x great-grandfather, Abraham Israel, came from Poland, and our family has strong ancestral ties to Ukraine. These results fit well with what we know so far.

    MyHeritage

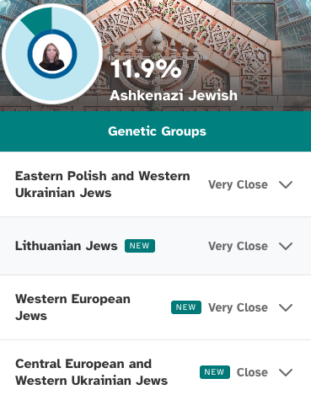
    MyHeritage has once again accurately identified my European origins, while also providing a more detailed breakdown of my Ashkenazi ancestry.

    MyHeritage claims to offer the most diverse and detailed Jewish ethnicity analysis available, with five Jewish ethnic groups and 55 Genetic Groups of Jewish origin.

    European Breakdown

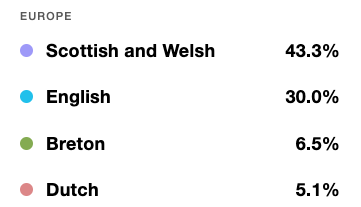
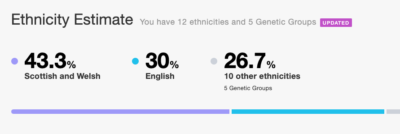
    My results show:

    • 43.3% Scottish & Welsh

    • 30.0% English

    This seems reasonable, especially if the Welsh category includes some of my West Midlands ancestry. However, I find it odd that Scottish and Welsh are grouped together.

    The biggest surprise in this update is the unexpected appearance of:

    • 6.5% Breton

    • 5.1% Dutch

    These results seem questionable, and I suspect they may disappear in future updates.

    Ashkenazi Jewish Breakdown

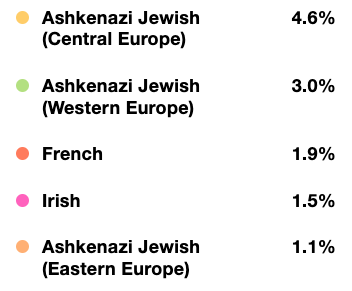
    Unlike other testing companies, MyHeritage provides a more nuanced interpretation of my Jewish ancestry, dividing it into:

    • 4.6% Ashkenazi Jewish (Central Europe)

    • 3.0% Ashkenazi Jewish (Western Europe)

    • 1.1% Ashkenazi Jewish (Eastern Europe)

    This level of detail helps clarify regional origins within my Ashkenazi lineage, which aligns with what I know about my family’s history.


    Family Tree DNA

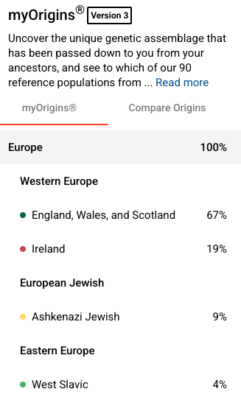
    My FamilyTreeDNA myOrigins® Version 3 Results

    Here’s a look at my latest myOrigins® Version 3 results from FamilyTreeDNA. As expected, my ancestry is 100% European, but the breakdown offers some different results from the other testing companies.

    Western European Ancestry

    • England, Wales, and Scotland – 67%

    • Ireland – 19%

    This aligns well with my known family history. The grouping of England, Wales, and Scotland together makes it harder to pinpoint specifics, but given my strong West Midlands roots, I assume much of this percentage is from that region. The 19% Irish is also intriguing—it could be linked to either my Scottish or West Welsh ancestors, though more research is needed to confirm.

    European Jewish Ancestry

    • Ashkenazi Jewish – 9%

    This fits closely with what I already know about my Ashkenazi Jewish heritage, which comes from my great-grandfather’s line. It’s interesting to see this as a single category here, whereas other testing companies sometimes divide Ashkenazi ancestry into more specific regions.

    Eastern European Ancestry

    • West Slavic – 4%

    This is an interesting addition. My Ashkenazi Jewish ancestors had strong Polish and Ukrainian ties, so it makes sense that a Slavic percentage appears in my results. It would be interesting to see if this changes in future updates.

    Overall, these results are a good match for my documented genealogy, though the broad regional groupings leave some room for interpretation. It will be interesting to compare this with future updates and results from other DNA testing companies!

    LivingDNA

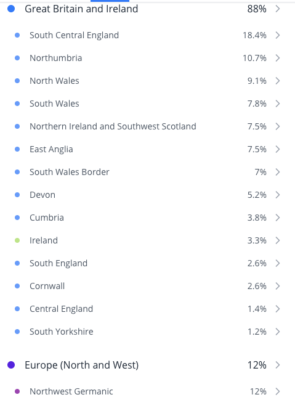
    My Living DNA results provide a detailed breakdown of my British and Irish heritage, with 88% of my ancestry linked to regions across Great Britain and Ireland. Unlike some other testing companies, Living DNA offers a more regionalized view, identifying specific areas where my ancestors may have lived.

    British Isles Breakdown

    The largest proportion of my ancestry is from South Central England (18.4%), which aligns with my known family history. There are also notable contributions from Northumbria (10.7%), North Wales (9.1%), and South Wales (7.8%), suggesting a mix of English and Welsh ancestry. The Northumbrian doesn’t fit with documented research nor the results from other companies, but the Welsh is more accurate.

    Other regions appearing in smaller percentages include:

    • Devon (5.2%) and Cornwall (2.6%), possibly indicating connections to the West Country.

    • Cumbria (3.8%), which may be linked to the English-Scottish border region.

    • South Yorkshire (1.2%), a relatively small proportion but still notable.

    No Jewish ancestry has been identified in this breakdown, despite its appearance in results from other companies. It is unclear where it is.

    Germanic Ancestry

    Unlike previous tests, Living DNA has identified a 12% Northwest Germanic component. Could this be connected to the missing Ashkenazi ancestry? Or could it reflect historical migration into Britain, possibly from Anglo-Saxon or Viking populations>

    Conclusions

    Overall, my updated BGA results offer a detailed view of my British ancestry, highlighting multiple regional connections and providing valuable insights into broader ancestral patterns. However, there is still room for improvement, and I look forward to future updates.


  3. 23andMe DNA Test

    As part of DNA Day 2018 on 25 April, 23andMe offered AncestryDNA users the chance to upload their raw DNA for free.

    23andMe is the only major genetic genealogy testing company with which I haven’t tested. When I saw a tweet from @AtcherleyONS saying the offer was about to run out, I jumped at the chance.

    After a couple of false starts and a complaint email to 23andMe, I was able to upload the DNA. I received my four free reports a short time later.

    23andMe is unique for being the only major family history DNA testing company that offers health reports. My free reports included two Wellness Reports and two Ancestry Reports. Of the latter, the first comprised ethnic origins and the second focused on cousin matching.

    23andMe estimate my Ancestry Composition as follows:
    • European 99.5%
      • British & Irish 49.1%
      • Ashkenazi Jewish 11.2%
      • French & German 4.0%
      • Scandinavian 3.1%
      • Eastern European 0.4%
      • Iberian Less than 0.1%
      • Broadly Northwestern European 28.4%
      • Broadly Southern European 0.3%
      • Broadly European 3.1%
    • East Asian & Native American 0.4%
      • Broadly East Asian 0.4%
    • Western Asian & North African 0.2%
      • North African & Arabian 0.2%
      • Broadly Western Asian & North African Less than 0.1%
    • Unassigned Less than 0.1%
    Although this corresponds broadly with the results of my AncestryDNA test, it does not match exactly.
    Wellness Reports
    These indicated that I have a Muscle Composition which is uncommon in elite power athletes. As I’m not particularly athletic, this is not surprising.
    And my Sleep Movement is of likely average or less movement, which seems reasonable.

    My favourite part of this, and something that seems unique among the main testing companies, is that 23andMe provides “Your Ancestry Composition Chromosome Painting”. Specific ancestry and that shared with others is clearly visible. My Ashkenazi ancestry, for example, is clearly defined. 23andMe describes the feature as follows:

    These are your chromosomes; we’ve painted them with your Ancestry Composition results. The first 22 are called autosomes and come in pairs of two, each represented by one of the colored horizontal lines in the graphic below. Chromosomes have different lengths, and are named 1 through 22, when sorted by size (scientists are not very creative). Lastly, we also look at ancestry on your X chromosome: two copies like the autosomes if you are female, and only one copy if you’re male (that you got from mom).

    The “Your DNA Family” section of the report tells me I have 1093 DNA Relatives in the 23andMe database. This only gives an overview of my matches (1 Close Family to Second Cousins; 727 Third to Fourth Cousins; Many Fifth to Distant Cousins). In order to see the full DNA Relatives list of individual cousins, I need to pay for a kit.

    UPDATE SEPTEMBER 2020

    In October 2019, I paid for a kit and upgraded to the full 23andMe experience.

    As well as the ancestry information to which I already had access, I was delighted to learn that my maternal haplogroup is T2b, described by 23andMe as:

    As our ancestors ventured out of eastern Africa, they branched off in diverse groups that crossed and recrossed the globe over tens of thousands of years. Some of their migrations can be traced through haplogroups, families of lineages that descend from a common ancestor. Your maternal haplogroup can reveal the path followed by the women of your maternal line.

    As a woman, I have no Y-DNA. I know of my paternal DNA through a test taken by my grandfather for FTDNA some years ago. Male 23andMe customers would learn both their maternal and paternal haplogroups through this test. This is more than offered through an Ancestry test, for example.

    I now have access to 66 health reports. None of these has made a significant difference to my approach to health. I am fortunate that no major problems have been identified.

    My 34 traits are of variable certainty, but the earwax type and eye colour are precise. For hair texture, the results predict I have a 39% chance of slightly wavy hair – which I do have. In the weird and wonderful section, though, the prediction about hair thickness is wrong. On a positive note, my toe length ratio of the big toe is longer than others is also accurate.

    Paying for access has opened up contact with DNA relatives. I currently have 1372 cousins on the database. Some of these cousins I know already through other tests, such as Ancestry and MyHeritage. We know exactly how are related. My closest relative at present is a 2nd cousin. There is an option to connect with cousins in order to share further information.

  4. My DNA: Living DNA Results

    Recently I was sent a complimentary test by a new British ancestry DNA company, Living DNA.

    The company, based in Frome in Somerset, has just launched in the UK, but is working with experienced mathematical genomicists like Professor Simon Myers of the University of Oxford (one of the team of academic researchers (https://www.gensci.net/) from various UK universities who in partnership with Living DNA developed the autosomal ancestry test) to help interpret customers’ results.

    “This is a whole new approach to DNA ancestry testing, and it is highly personal. No other method – either in scientific literature or in the field of personal genomics – can identify the ancestry of a single person to the level of regions within the UK.”

    Dr Dan Lawson, University of Bristol

    As such, Living DNA claims to have developed the world’s first DNA test which allows people to break down their British ancestry to any of 21 regions in the UK, and that shows how their worldwide ancestry from 80 population groups has evolved over history.

    The 21 regions covered are:

    • Aberdeenshire – Aberdeen and the surrounding areas of Northeast Scotland
    • Central England
    • Cornwall
    • Cumbria
    • Devon
    • East Anglia
    • Ireland
    • Lincolnshire
    • North Wales
    • North Yorkshire
    • Northwest England
    • Northwest Scotland
    • Northumbria – “a unique genetic signature that can be detected within the region today”
    • Orkney
    • South Central England
    • Southeast England
    • South England
    • Southwest Scotland and Northern Ireland – “There is a shared genetic signature for the areas now known as Northern Ireland and the Southwest of Scotland, including Dumfries and Galloway. The areas are divided by a watery barrier, yet historical migrations across the sea have led to a shared genetic legacy between them.”
    • South Wales Border
    • South Wales
    • South Yorkshire


    This test uses the latest GSA Illumina chips, and their algorithms have been developed in partnership with members of the team behind the landmark People of the British Isles study of 2015. Living DNA is keen to stress that this is a geographic test, focusing on where people have lived, rather than on ethnic diaspora/population community groups such as Jewish Askenazi.

    The aim of the project is to show how we are all connected and the company is keen to use DNA testing to help combat racism by demonstrating that race is only socially constructed – there is not genetic foundation for the concept of race. To that end, the company is working in schools on projects with Show Racism the Red Card.

    “Compared to other ancestry tests out there, Living DNA is like viewing your family history on a high definition TV. By combining the latest DNA testing technology with the most robust academic research, we can give users the most accurate picture of their estimated ancestry.”

    David Nicholson, managing director, Living DNA

    Claiming to be the most academically robust on the market, the test does not use admixture but examines the way DNA is linked together. The aim is to bring academic work to individual consumers around the world, including family historians. As the test is new, results will be updated continually and results amended over time. This is particularly the case for areas where samples are currently low, such as with the area of southern Ireland.

    For my test, I did not need to send a DNA sample. I simply submitted my raw data (taken from a prior genetic genealogy test). The test works autosomally, reading from the 22 of the 23 chromosomes that make up each person’s DNA using technology based on the Living DNA Orion chip (comprising software and unique reference databases). Autosomal DNA is inherited randomly from our ancestors, meaning that siblings can show a different inheritance in this test. One brother may have inherited more DNA from a Welsh 4x great grandmother, for example, than his sister. Thus the test provides a unique insight into each individual’s geographic inheritance.

    Map showing the distribution of my DNA.

    Professor Myers told me that while the team is able to quite precisely identify regional contributions within the British Isles, the genetic differences they are identifying are also very subtle. Most people’s ancestors are likely to come from a more geographically diverse set of locations in the 6-10 generation period than are exactly traceable using genealogies. In general, it’s harder to precisely pin down contributions that make up only very small amounts of DNA geographically, because they give less data for analysis.
    On first glance, my results make sense compared with my known ancestry. They indicate that I have 90.7% British Isles DNA, which matches roughly with results from other autosomal tests.
    In comparison, my Ancestry test indicated 85% Great Britain, Family Tree DNA suggests 72% British Isles, while DNA Land has me as 76% Northwest European (which covers Scottish Argyll_Bute_GBR and British in England; Icelandic in Iceland; Norwegian in Norway and Orcadian in Orkney Islands).

    Within the Living DNA’s 90.7% British Isle results, my genetic breakdown is as follows:

    • South Central England 18.2% [update Aug 2017: 19.3%]
    • Central England 14.3% [update Aug 2017: 4.5%]
    • South Wales Border 9.8% [update Aug 2017: 23%]
    • North Wales 9% [update Aug 2017 8.8%]
    • South Wales 7.6% [update Aug 2017: 9%]
    • Northumbria 6% [update Aug 2017: 5.5%]
    • Cornwall 4.7% [update Aug 2017 4.3%]
    • East Anglia 4.4% [update Aug 2017 2.3%]
    • Devon 3.6% [update Aug 2017 2.5%]
    • Northwest England 3.2% [update Aug 2017 2.5%]
    • Southwest Scotland and Northern Ireland 2.6% [update Aug 2017 2.7%]
    • Cumbria 2.6% [update Aug 2017 2%]
    • Orkney 1.6% [update Aug 2017 1.4%]
    • Aberdeenshire 1.1% [update Aug 2017 2.8%]
    • British Isles (unassigned) 1.8% [update -]
    • Southeast England [update Aug 2017 1.3%]

    As I have recently been learning Welsh in order to help with family history research (as well as visits to Wales), I was pleased that, according to these results,  the Welsh contributions adding up to 26.4% indicate that I am 1/4 Welsh. In these results,  the “Welsh borders” also includes some English regions bordering Wales (such as Shropshire where I have known ancestors). However, Professor Myers clarified that usually, Welsh ancestry is not mistaken for other places. 5/32 of my 3x great grandparents were born in Wales. Others may have had Welsh ancestry which has been picked up autosomally. [August 2017 update: my Welsh contribution now adds up to a whopping 40.8%. It remains to be seen how much of this is from the English border counties . . . ]

    Description of the Central region from the Living DNA website.

    Regarding my ancestors from Central England, this area seemed a bit vague. The description references Mercia, which in the past included Staffordshire, Worcestershire, Warwickshire and Shropshire. Of my 32 3xgreat grandparents, 15 were born in this region. The test broadly divides Central England into two zones, one more Northerly and one more Southerly.

    I was a little confused by the definition of the “S. Central England” region (which would also include Gloucestershire, Somerset, Oxfordshire etc.), as I do not have any recent ancestry from those counties. However, Professor Myers told me that Wiltshire, where 2 of my 3xgreat grandparents were born, heavily overlaps and they would expect/hope for ancestry from Wiltshire to be attributed to this region (and sometimes also to S. England). I told him that I had ancestry from Hertfordshire and Bedfordshire, also, and he suggested that this might contribute more to the N. Central England region, but that as these regions are neighbouring and also extremely similar genetically, some overlap is expected.

    Two of my 3xgreat grandparents are from Norfolk and my genetic connection to them has been proven through another genetic DNA test. East Anglian DNA is very similar to that of Germany – indicating that of all the British regions, this is the most Anglo-Saxon. Others contain the presence of Vikings, Jutes, Danes, Normans and, of course, Celts. Although, my East Anglian results are only small here, they fit with the small percentage contributed by these Norfolk ancestors. Professor Myers explained that as my Norfolk-born great, great grandmother, Maria Pymer Jolly, is separated from me by four generations of random inheritance (or non-inheritance), this means I won’t always get exactly 6.25% (the percentage presented by a 2x great grandparent) of DNA from her. She might genuinely have only given me 4-5% of my ancestry – with other ancestors being over-represented instead. He went on to say that the test is not *so* precise currently that the proportions for these small contributions are exactly accurate.

    For me, the oddest results were those indicating that I have ancestry from Cornwall and Devon. I wondered if within the 10 generations, I might have South Western ancestors who moved the relatively short distances north to Wales or Wiltshire. Plymouth in Devon, but on the border of Cornwall, is just 143 miles from Devizes, where one of my 3x great grandmothers was born, for example. Newport in south Wales is just over 60 miles away from Devizes. Professor Myers agreed that this interpretation of local movements seems very sensible, as the test is reasonably confident there is some ancestry from these regions at some point.

    For the 1.8% unassigned (British) ancestry, he explained that this means Living DNA thinks the ancestry is from the UK, but in their evaluation of uncertainty in my results (where they essentially reanalyse my genome after “resampling” its parts, a standard statistical approach) this 1.8% could not be confidently pinned down geographically. After a second look at the data, Professor Myers said his “best guess” for the 1.8% is actually Southern England, which could fit with my Wiltshire ancestry.

    My 2x great grandfather, William Jolly, was born in Montrose, Forfar (now Angus) but his parents were from Kincardineshire, which Living DNA places in Aberdeenshire and/or Northwest Scotland as it falls right at the border of the two different regions). It is possible that the evidence of ancestry in South west Scotland & Northern Ireland, Orkney, Aberdeenshire, and possibly Cumbria, all comes from this part of my family tree.

    There is still more research to be done on my tree by more and more analysis by Living DNA on my genetic data. However, the results so far appear to be a positive start to understanding my British genetic ancestry.

    Living DNA’s test itself is run on a custom-built “Living DNA Orion Chip”. It is one of the first bespoke DNA chips in the world to be built using the latest GSA technology from market leader Illumina, and tests over 656,000 autosomal (family) markers, 4,700 mitochondrial (maternal) markers and 22,000 Y-chromosomal (paternal) markers.

    A lifetime membership to Living DNA costs £120, including a swab kit, the DNA ancestry test itself and access to a personalised, interactive results platform. Test results typically take 8-12 weeks before they are available, and a bespoke coffee table book of the results costs an additional £39 plus postage and packing. A membership also includes free lifetime updates to people’s results as new ancestry research and population groups are added to the platform and as science evolves.

    Update 26 October 2017

    Living DNA sent a press release revealing that their, “One Family One World project is the first of it’s kind to attempt to analyse people’s DNA results from around the world allowing them to see where they fit into a One World Family Tree, demonstrating how everyone is related if you go back far enough in time and produce an in country regional breakdown of DNA from around the world. The project involves the use of proprietary technology, artificial intelligence and machine learning, and will see tens of thousands of computers working together to identify distinctive and shared patterns in people’s DNA. Eventually we will be running in-country regional projects across the world, today people can join no matter where they are from and we already have a number of specific projects that can be seen here – https://www.livingdna.com/one-family/research. You can find out a lot more information on the project, and how to get involved by visiting the website at www.livingdna.com/onefamily.”
    Living DNA goes on to say that, “If you know anyone that’s already taken a DNA test they can upload their DNA for Free and will benefit from a new type of DNA Matching in mid 2018. . . DNA Matching is in final stages of testing for Living DNA clients, we are still aiming to get this live by the end of the year. People taking part and uploading their DNA for free don’t get the regional UK breakdown just DNA matching when live and all the other things that will come out of the project. Therefore it’s not a substitute for a Living DNA test.”
  5. Genetic Genealogy: My AncestryDNA Results

    Genetic genealogy is becoming increasingly important to contemporary family history research. When a paper trail fails us, a DNA test may provide the missing piece to the puzzle of illegitimacy, unofficial adoption, or unclear ethnic origins. Recently there have been well-publicized accounts of foundlings discovering a parent and of others finding biological ancestors previously unidentifiable in historical documents.

    AncestryDNA-kitPaper documents are essential to family history research. The birth/marriage/death certificates, censuses, wills, church records, newspaper reports, and so on tell us (or give us clues about) the identities of our ancestors. But where the “wrong” father’s name is given on a birth certificate, or no clue exists as to parental identity, genealogists can become stuck.

    With improved accessibility and competitive pricing of family history DNA tests over the past five years, the potential of genealogy has been transformed. You may not know the identity of your father, for example, but through DNA testing you could discover a relative of his, or establish his ethnic origin. To this end, AncestryDNA launched its tests in the UK early this year. I received the results of my tests this week and have analyzed them below.

    Autosomal DNA

    There are three main types of DNA test for family history research:-

    • Y-chromosome (Y-DNA)
    • Mitochondrial DNA (MtDNA)
    • Autosomal

    Y-DNA is used to research the paternal line. The test can be taken by males only. The MtDNA test can be taken by men or women but is used to research the maternal line only. The autosomal test can be taken by men or women and tests the DNA inherited from autosomal chromosomes. In a nutshell, this is DNA inherited from all of our ancestors back to our 3rd great grandparents and some of the DNA inherited from ancestors up to the 10th great grandparents. For a detailed account of autosomal DNA see this ISOGG Wiki.

    In family history, we can use autosomal DNA primarily for three aims:

    • to find matches with our genetic cousins
    • to identify our recent ethnic origins
    • to find information on our health.

    The largest companies that provide tests for the first two of the above aims are Family Tree DNA (FTDNA), AncestryDNA, and 23&Me. I tested with FTDNA in 2012. FTDNA provides Y-DNA and MtDNA tests alongside their autosomal test, which is known as Family Finder.

    The third of these aims, health information, is provided commercially by the company 23&Me. Otherwise, raw data from Family Tree DNA and AncestryDNA tests can be uploaded for free to Promethease, but care should be taken with this as no analysis of results is provided.

    AncestryDNA tests only for autosomal DNA. Currently, the company does not offer any Y-DNA or MtDNA testing.

    The AncestryDNA Test

    Taking the test was relatively straightforward. I did have to activate the kit by using Ancestry in Chrome rather than my usual Firefox browser, but other than that there were few problems. Unlike FTDNA, which requires a cheek swab, for the AncestryDNA test I had to spit several times into a vial. I then had to fasten the lid tightly without breaking it – which I found quite tricky. Eventually, I managed it and then posted off to Ireland.

    A few weeks later, I found my AncestryDNA results by checking on the DNA tab on the Ancestry website. Below is the page showing my results. For privacy reasons, I have removed the images of my genetic cousins which sit below the “DNA Matches” heading.

    AncestryDNA main page

    The results are all summarized on this page. On the left is a pie chart showing a broad estimate of my ethnic origins. By clicking on this option the full breakdown is revealed.

    Cousin Matches

    On the right in the screenshot above is the section revealing my DNA matches. The last point on the far right suggests that I have 19 4th cousins or closer. In fact, when I click on these cousins, they are all suggested “4th-6th cousins”. The confidence of these cousins being within this range is only “Extremely High” for one match but “Very High” for the other 18. I have 37 pages of matches. Most are in the 5th-8th range, and are thus difficult to match with my known ancestors.

    DNA tests for family history do not tell you how you are related to a match. You have to work that out for yourself. The test can be used to confirm a relationship with a second cousin, for example, whom you may have found through your family history research or from a shaking leaf on your Ancestry tree. A second cousin should almost always (99% probability) show up as a match in an autosomal DNA test. There is a 90% chance that a 3rd cousin will show up, but far less probability for a 4th cousin. This is because while the two 4th cousins could inherit DNA from their shared ancestor, this may be from different parts of distinct chromosomes. For this reason, care should be taken when using the test to match with those cousins who match distantly on paper. On the other hand, you could find that you share DNA with someone who shares a far more distant ancestor, like a 10th great grandparent. For these reasons, it is helpful to ask as many of your known cousins to test: it is difficult to predict beyond 2nd cousins who will show up in your autosomal DNA matches.

    One of the benefits of AncestryDNA is that, in theory, you can compare the ancestry of your matches with your own ancestry using the Ancestry Family Trees. Unfortunately, this only works if both you and your match have uploaded a detailed family tree . . . and if the corresponding ancestor has been added. Of my “close” 19 genetic cousins, only 12 have added a family tree. Of those 12, 6 have added less than 100 ancestors to their tree. I have contacted 4 of these matches to see if we can find a common link, but have received only one reply so far. This can be one of the frustrating aspects of genetic genealogy.

    On the FTDNA website, you can use phasing to work out the possible branches on which you match your relative. Below is a screenshot from my Family Finder matches showing the option to click on “In Common With”. After clicking this, a list of all the cousins who match with this relative (in this example, it is my father) will appear. Family Finder also includes details of the number of shared centimorgans (cM) and a chromosome browser which reveals on which chromosome(s) you are connected to each cousin.

    FamilyFinder pageIn contrast, AncestryDNA has a “Most Recent Common Ancestor” feature. When you review your matches you will see whether some of the proposed cousin matches have trees attached to their results. Once you click into this (provided they have made their tree public), you will be able to see a list of common surnames across both your tree and theirs.

    DNA CirclesLinked to this, Ancestry has a “DNA Circles” section to identify another user who is a DNA match and has the same ancestor in his/her tree. Using the circles you can add a third person who also has matching DNA, or a fourth. The idea behind this is that it is more likely that you’re all related because you’re descendants of a particular ancestor. However, as you can see from the screenshot of my Ancestry results above, I am yet to be included in any circles.

    Another feature for finding common ancestors is the maps and locations tab which allows you to find matches using a location perspective (i.e comparing the people in your tree versus your potential matches).

    So far, it seems that AncestryDNA has good potential for identifying my genetic cousins. One oddity I have found concerns a match who appears in both my Family Finder and my AncestryDNA matches lists. He is clearly the same person as not only does he have the same name, he has exactly the same photograph. For privacy reasons, he shall remain anonymous here, but what is notable is that on Family Finder he is identified as a 2nd-4th cousin, whereas on AncestryDNA he is only a suggested 5th-8th cousin. There is a big difference between the two. I have been in email contact with this cousin but we are yet to prove the link between us. Until then, it is uncertain whether Family Finder or AncestryDNA is the more accurate in measuring our cousin relationship.

    Ethnic Origins

    Family Finder estimates that my ethnic origin is 87% European. This is broken down into 72% “British Isles”, 10% Eastern European, and 5% “Western and Central Europe”. 

    Regarding my European origins, Ancestry identifies me as having 85% from “Great Britain”. Separately from those, 5% is “Irish”. In the Ancestry test, “Irish” is regarded as separate from British ancestry. From Y-DNA testing we know there is some Irish ancestry on my Scottish JOLLY branch. However, contrasting this with the paper trail suggests that 5% may be too great an estimate. Nevertheless more work needs to be done on this and it is possible that there is Irish ancestry on one or more other branches of my tree.

    Conclusion

    For DNA tests to be useful for family history research, more people are needed to test. The larger the pool of testers, the more likely it is that those of us who have taken tests will find matches. As shown by both Family Finder and AncestryDNA, most of my ancestors in the past 15 generations are from Great Britain. It is probable, therefore, that I will match with more testers if they or most of their ancestors originate in Britain. That AncestryDNA has only recently launched in the UK is exciting for users like myself. I am looking forward to finding more matches over time as more Britons take the test. I just hope that when they do, they take the opportunity to add as many ancestors as they can to their Ancestry trees and that they respond to online messages.

    On that note, if anyone reading this blog recognizes me in their matches on either Ancestry or FTDNA, I would be very delighted to hear from you!

    In this post I have touched only briefly on the very complex science of genetic genealogy. For a clear and comprehensive account of family history tests and the genetics behind them, I recommend Debbie Kennett’s DNA and Social Networking (The History Press, 2011).

    UPDATE APRIL 2016

    Since I posted this, I have received two Ancestry DNA “hints”. These are indicated in the DNA section of my Ancestry profile by the shaking leaf symbol. In the examples on my profile (see screengrab below) the two matches were suggested to be a 4th cousin and a “distant cousin”. Ancestry user names have been removed from the screengrab below to protect privacy.

    Hints page Ancestry DNA

    Both of these Ancestry users have proved to be identifiable cousins thanks to the information in their (and my) online trees. As you can see in the above image, both of my newly-found cousins have high numbers of people in their online Ancestry trees. I also have several thousand people recorded in my Ancestry tree. Using the information we have inputted, the Ancestry DNA technology was able to identify our mutual ancestors (as shown in the screengrabs below).

    This screengrab shows that my match here was correctly identified by Ancestry as my 4th cousin. We share Norfolk ancestors, Clark Pymer and Ann Oxborough.

    Update Ancestry DNA Mar 2016 screengrab


    Ancestry DNA blog update

    The second screen grab shows that this ancestor, Emanuel Billingham (1750-1837), is further removed from my cousin and me. Here Ancestry is able to identify that my match is my 5th cousin 1x removed.

    I was hoping that there would be a way of confirming that these two Ancestry users were my cousins, as there is on FTDNA. Unfortunately, the only method appears to be through the Ancestry DNA Circles I mentioned above. In order to create an Ancestry DNA Circle (or for one to be created for you), there needs to be three confirmed matches. So far, I only have two for each ancestor.

    Thanks to Debbie Kennett for pointing me to this Ancestry DNA blog which explains in detail the requirements for Ancestry DNA Circles: http://blogs.ancestry.com/ancestry/2014/11/20/new-ancestrydna-technology-powers-new-kinds-of-discoveries/

    UPDATE 17 September 2020
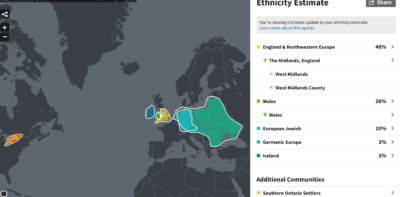
    Ancestry sent the following statement alongside the update:

    As you may know, we’re constantly evolving the technology and methods behind AncestryDNA®. Using a combination of scientific expertise, the world’s largest online consumer DNA database, and millions of family trees linked with DNA results, we’re releasing our most precise DNA update yet. With this latest update, you’ll notice that we now have four regions in the UK and Ireland, rather than two; England & Northwestern Europe, Wales, Scotland, and Ireland. Because the DNA from our reference groups in Scotland and England are so similar, it’s possible that if you have English ethnicity, particularly northern England, you may now find an increased percentage of Scotland in your results and vice versa.

    On the whole, my ethnicity breakdown is similar to how it was before this latest update. The Welsh content fits with my known ancestry on both my paternal and maternal sides.

    However, as the JOLLY line is all Scottish prior to 1876, I would expect to be 1/16 Scottish. I was surprised to see my small Scottish percentage has now disappeared. It appears to have been replaced by Irish ethnicity. Interestingly, a Y-DNA test indicated that there may be Irish origins. However, they would only be on the Jolly line itself – not on all the other lines within Scotland.

    It seems to me that the Irish and Scottish ancestry has merged slightly in this latest update. I expect the next update to revert to some Scottish ancestry for me.

Latest From Emma's Blog

A History of the Census Takers: Recording the Nations by Mish J Holman (Pen & Sword, 2026)

Looking beyond the census returns to explore the lives and personalities of the people who created them A History of […]

[Read more]

Book Review and Author Interview: A History of Parish Registers in England and Wales: From the Restoration to Civil Registration by John Wintrip (The Lutterworth Press, 2026)

A History of Parish Registers in England and Wales: From the Restoration to Civil Registration by John Wintrip (The Lutterworth Press, […]

[Read more]

Member of The Society of Authors Member of The Association of Genealogists and Researchers in Archives Graduate of the Institute of Heraldic and Genealogical Studies Canterbury Member of the Society of Genealogists Pharos Tutors